During static analysis (you opened the file, clicked the analyze button), there will be no jumps in the graphs, all recalibrations will be performed before the graphs are drawn, and upon completion of the analysis, the final result will be immediately visible.
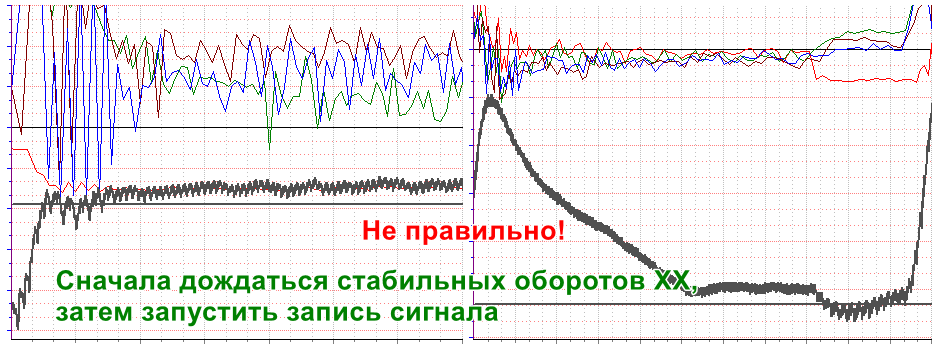
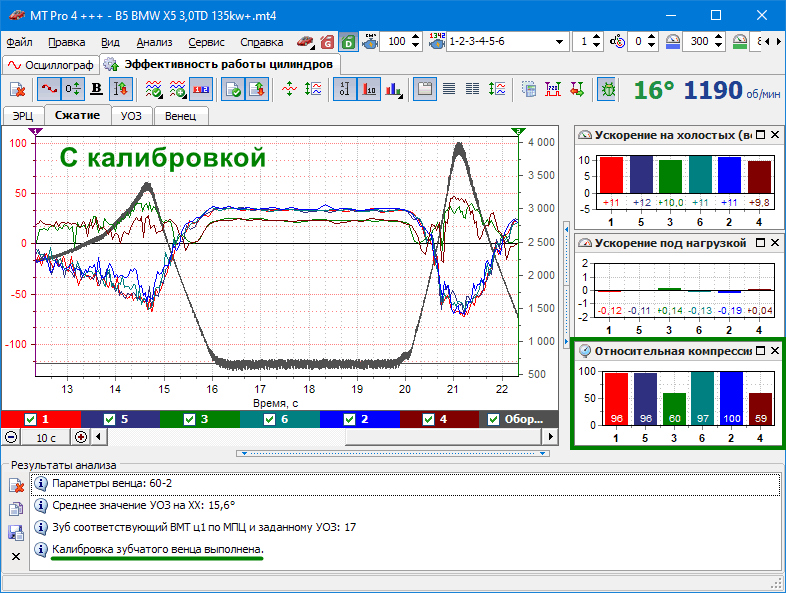
For diesel internal combustion engines, especially with low compression cylinders, during real-time analysis, before the first reset (calibration), acceleration, compression and bar graphs are likely to be significantly distorted due to significant uneven rotation of the KV. Therefore, their analysis is possible only after calibration, and the corresponding message appears in the results panel: The calibration of the gear ring has been completed.
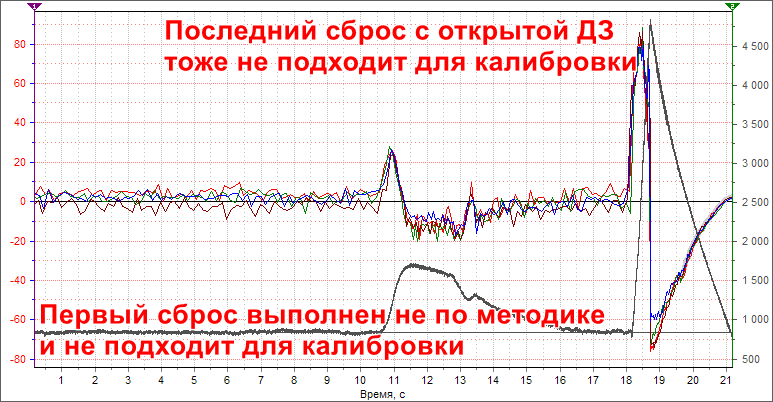
The most accurate calibration of the geometry of the gear ring of a diesel internal combustion engine will be when the engine is decelerated with the air supply to the cylinders blocked (with the intake duct closed or physically blocked), which is possible only at the last speed reset when the engine is turned off. As practice has shown, only 20% of the files in the database have blocked the air supply to the cylinders at the last RPM. In most files, at the last speed reset, the engine is either open or briefly closed, or the air is shut off by hand, often not tightly and not until the engine stops completely. The new algorithm will automatically evaluate the last RPM reset, find an area with blocked air supply to the cylinders, and then recalibrate. The worst case is not a dense and permanent physical blockage of the air supply, in this case the last reset will be a continuous transient process. If it is not possible to tightly block the air supply, it is better not to block it at all, the calibration accuracy of the geometry of the gear ring will be lower, but the qualitative results of the analysis of the diesel engine will be the same, with or without air overlap.
What affects the accuracy of calibration and analysis in general:
1. Follow the methodology described in the topic header.
2. The selected input range. If the signal range is ±5V, and the input range is ±100V, then the accuracy of determining the center of the tooth will be lower due to noise.
3. The selected sampling rate. Usually 200-500 kHz is enough, if lower, then the accuracy of determining the center of the tooth will be worse, if higher, then it's just an excess and there will be a lot of RF noise.
4. The number of crown teeth per cylinder, at least 3 teeth/cylinder, preferably 6 teeth/cylinder. If the crown has only 2-4 teeth, then the analysis is meaningless.
5. The condition of the crown and DPKV. If the geometry of the crown is strongly distorted, or the tooth center is covered in chips, then the accuracy of determining the center of the tooth will be worse.
6. The number of cylinders of the internal combustion engine. The more cylinders there are, the greater their physical mutual influence and the more difficult it is to isolate the contribution of each cylinder to the work of rotating the KV.
7. Twisting (torsional elasticity) of HF, especially evident in the Japanese.
8. Rigidity of the gear ring attachment (rubber damper, thin stamped discs).
7. The compression tab has been implemented
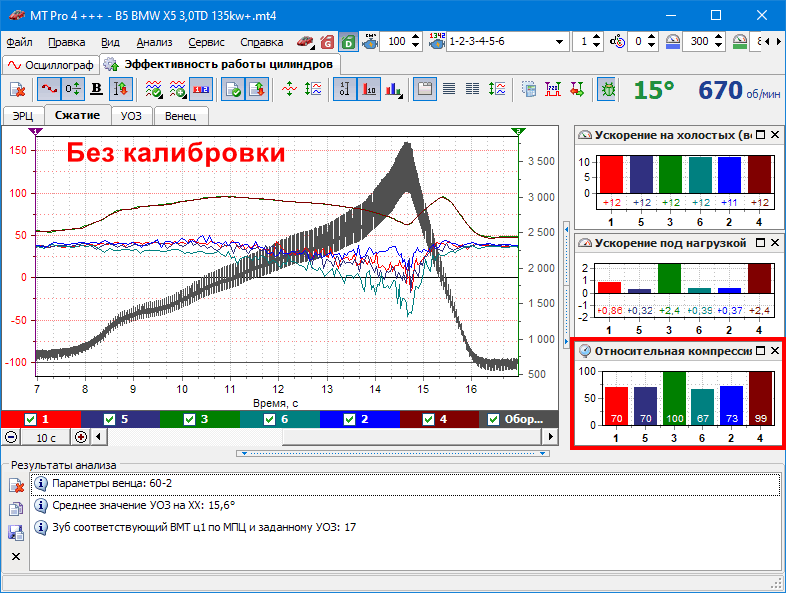
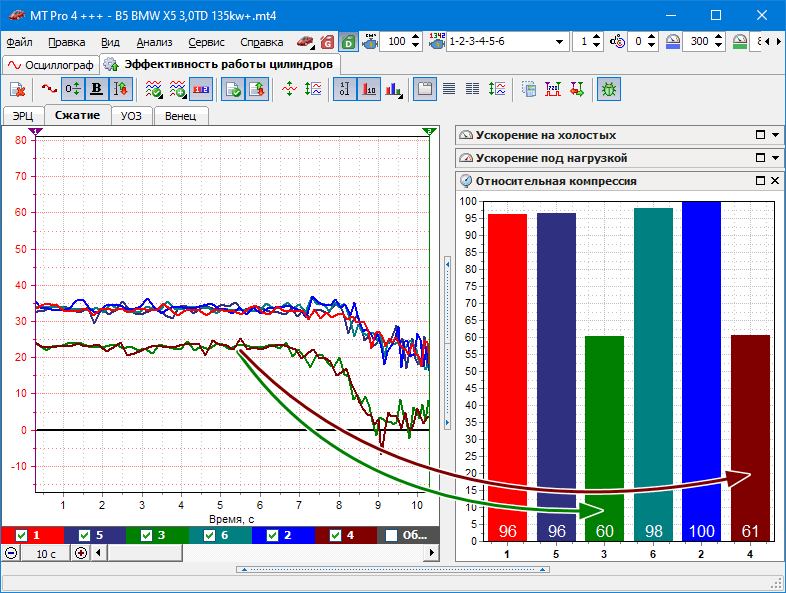
The graphs on the compression tab show how much the KV slows down in the compression stroke as the piston approaches the TDC. When the piston goes up in the compression stroke, it acts as an air spring. To compress the air, the engine needs to expend a lot of energy. This energy is taken from the inertia of the flywheel and the HF, which causes the HF to slow down. The higher the compression in the cylinder, the more the KV slows down, and the more energy is spent on air compression. The values of the graphs are proportional to the compression in the corresponding cylinder, i.e. the higher the tightness of the cylinder, the higher the values of the corresponding graph.
When analyzing diesel engines, the values of the relative compression bar graphs are calculated based on the compression graphs at XX (not at the last RPM, as in gasoline engines) and are reduced to a visually convenient range of 0...100%. That is, one of the cylinders will always have a relative compression of 100% relative to the other cylinders. The default scale is 0...100%.
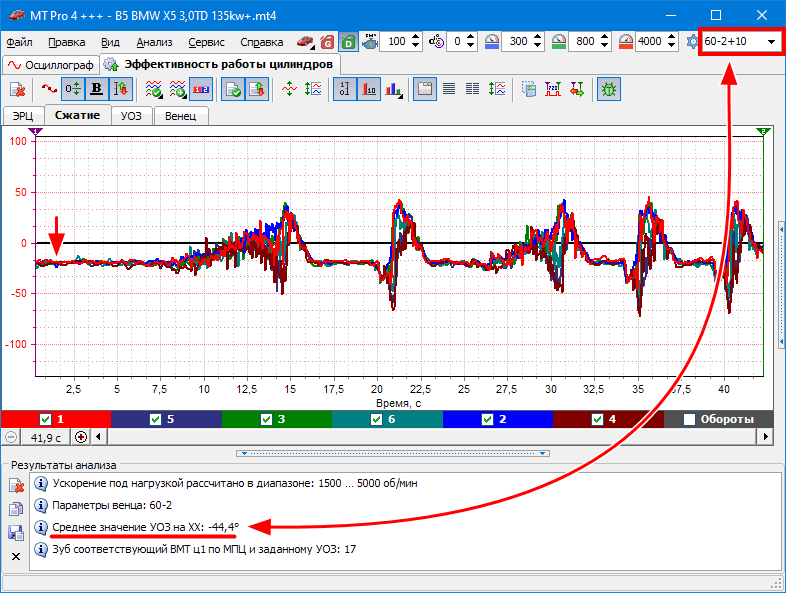
The value of the compression graphs significantly depends on the correctness of setting the parameters of the crown, namely the tooth of the corresponding TDC, and the angle of injection advance (currently in the UOZ program). If you see that the values of the compression graphs on XX are below the zero line, then pay attention to the calculated average value of the WO on XX and check that the parameters DPQ and UB are set correctly.
If the tooth of the corresponding TDC is not known for sure, then it is better not to set it, for example, set it to 60-2, and in the WO field, set the WO of the first pre-injection, since the program usually selects the first MPC (usually after the pulse detector, the same signal from the pre-injection and the main injection is obtained), which can be checked in the oscilloscope window.
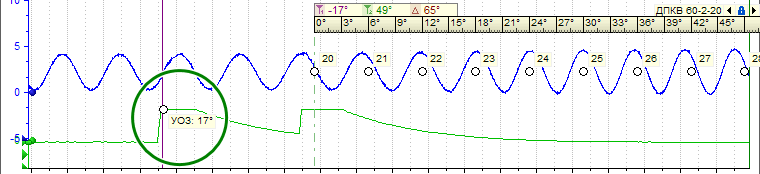
If there are no results of the previous analysis on the screen, the compression tab will be visible if diesel is selected in the fuel list, or the compression tab will be visible if the results of the analysis of the diesel engine are on the screen. Please note that the selected fuel type is saved to the data file only in the new version of the program. When opening previously saved data files, gasoline will always be selected. If you want to save the diesel fuel type in the data file, you must: select diesel, perform an analysis, and save the data file.
8. Comparison with Autoscope latest version CSS 2.53
Sometimes clients write: Autoscope shows more accurately, better, if I had it, I would have found everything right away.
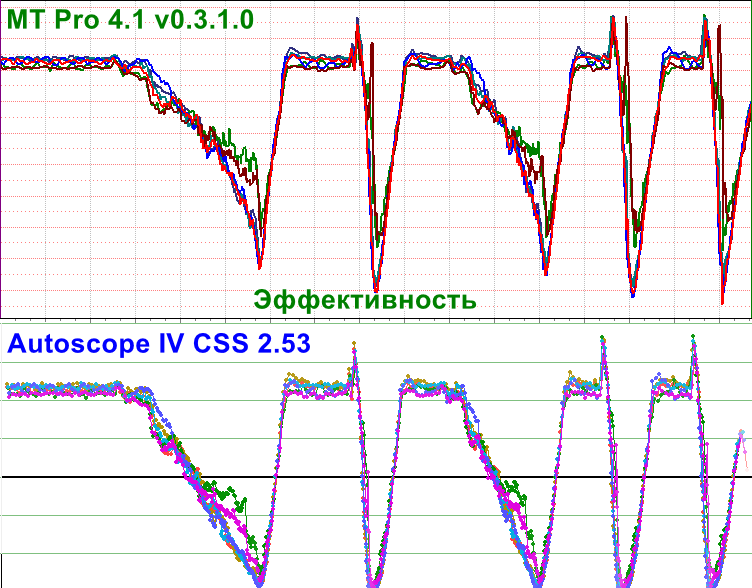
For comparison, I asked to record the same signal simultaneously on Autoscope IV and MT Pro 4.
BMW X5 3.0D low compression in C3 and c4.
The efficiency is identical.
The compression is identical.
In CSS 2.53, uninformative sections are painted over in white.
I didn't like it, I compressed uninformative sections.
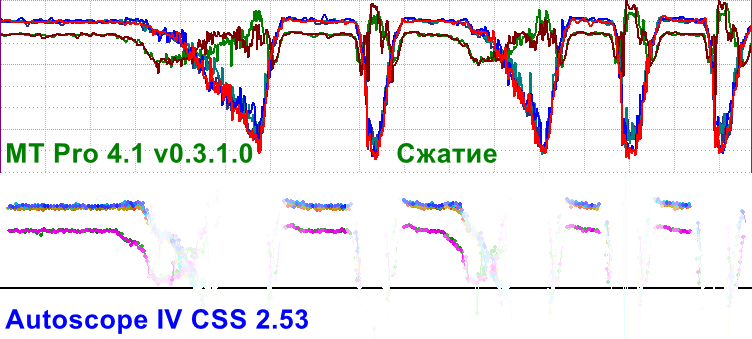
As you can see, the graphs almost match, of course there are minor differences.
Because they use the same ideas and similar algorithms.
The ERC in MT Pro is not a copy of CSS from Autoscope.
This is its own implementation, completely created from scratch, tested on thousands of different files.
The same thing about the Siemens ECU is not a copy of the Bosch ECU, although they do the same thing.
Abstract:
1. Gasoline - it has become a little more accurate for multi-cylinder internal combustion engines
2. Diesel
2.1. Online charts are valid only after calibration
2.2. If the charts are below zero, check the set parameters of DPQ and UB
2.3. At the last reset, you can not turn off, if you turn off it tightly and until the internal combustion engine stops completely.
The current version of MT Pro is 1,2,3
Ver: 0.3.1.0
The current version of MT Pro4
Ver: 0.3.1.0